cAUGHT IN THE GAP
-
More than 200,000 families are caught in the gap – living over the poverty line but unable to make ends meet
-
Our community has among the highest percentage of working poor in the country
-
Episodes of poverty are more common than chronic, persistent poverty
-
For more than 100 years, UWM has served families experiencing fluctuating periods of financial stability
But the federal poverty line doesn’t begin to tell the story of financial stability in our area, or the U.S.
Living wage calculators from MIT, Voices for Children, and the Economic Policy Institute among others calculate the income a family in our area needs to meet a basic needs budget. According to the most conservative estimate, a family of four in our area would need a minimum household income of $61,000 to make ends meet – more than twice the poverty standard.
Based on this income and data from the most recent American Community Survey, we estimate about 303,000 people (1 in 3 people) in the metro area are struggling to make ends meet. Of this, less than 90,000 are living in poverty – meaning the vast majority are caught in the gap between economic self-sufficiency and the federal poverty line.
Households caught in this gap are forced to make impossible choices each day.
When families cannot afford basic household necessities, they budget tradeoffs and employ coping strategies including stretching, substituting, borrowing or doing without. Recently, high inflation has increased the frequency of these practices among low-income families – resulting in skipped meals, postponed medical care and other longer-term impacts. A large body of research across housing, food and more shows the stress of these tradeoffs is toxic for both parents and kids.
In addition to challenges with daily expenses, households caught in the gap lack savings and will have trouble bouncing back from unexpected expenses. Nationally, 37% of Americans can’t afford a $400 emergency expense. When we asked callers to UWM’s 211 contact center how they would cover a $400 emergency expense – 90% said they couldn’t use cash or otherwise pay the bill immediately.
Covering a $400 Emergency Expense: 90% of 211 Callers Unable to Pay Immediately
Percentage unable to use cash or equivalent U.S. vs. 211
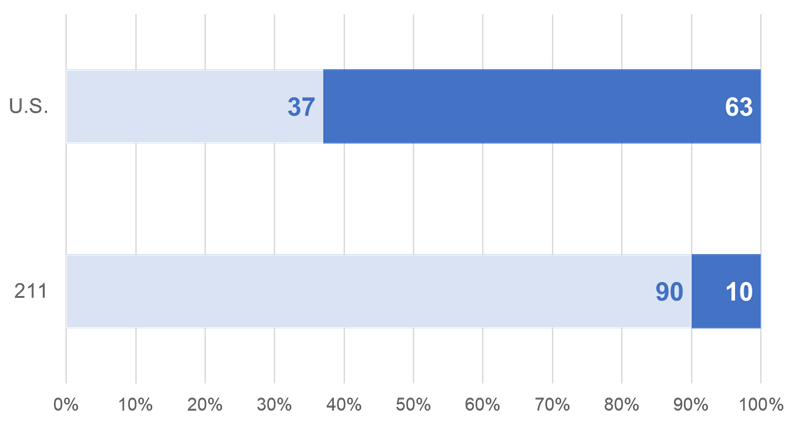
Pay over time, borrow from a friend, sell, loan, otherwise not able to pay
Able to pay immediately using cash or equivalent
On an already tight budget, an unexpected expense can quickly turn into a financial crisis – driving families in and out of poverty.
Overall, the poverty rate in the U.S. is 12.5% and 9.5% for the Omaha-Council Bluffs metro. But a census study shows that the poverty rate among families who have experienced poverty for only two months is actually much higher. The research indicates that over a 36-month period, 27.1% of families experienced episodes of poverty, while 3.3% experienced poverty for the entire period. So, while the poverty rate is an important economic indicator, it hides nuances related to the episodes of poverty families are more likely to face.
Poverty is Dynamic: Episodes of poverty are much more common than chronic cases
Overall poverty rate compared with episodic and chronic poverty over 36 months
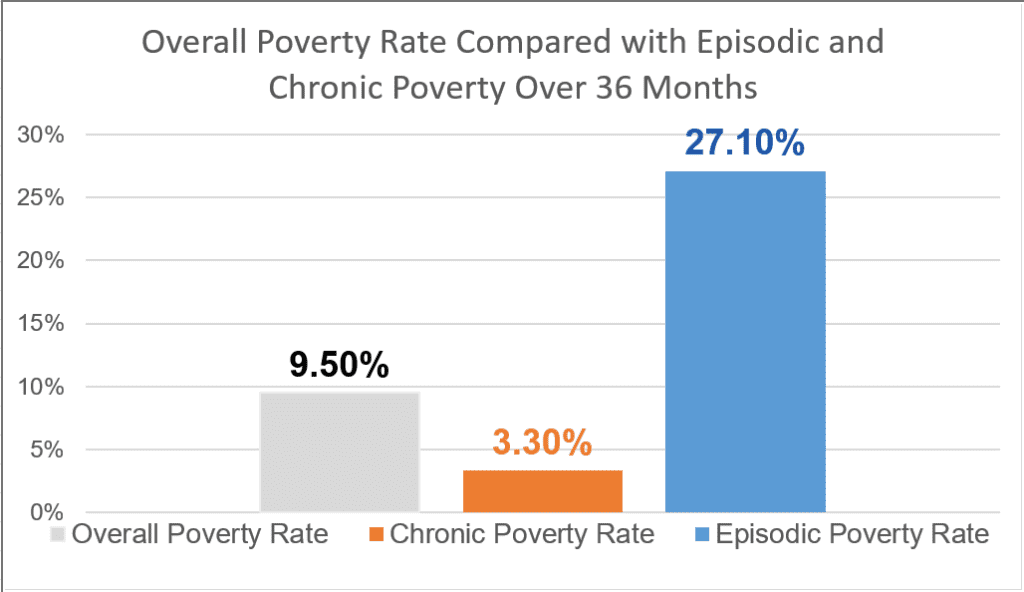
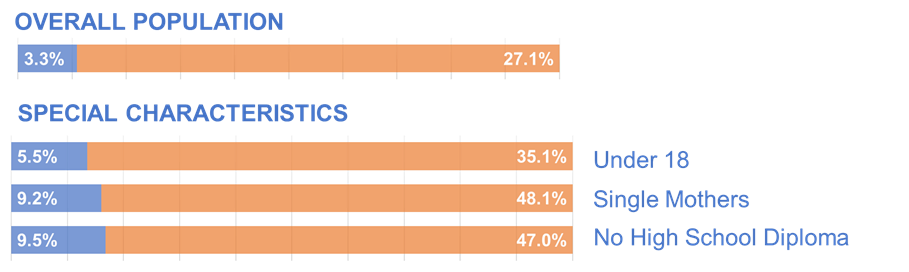
While rates of episodic and chronic poverty differ dramatically by age, educational attainment and other factors, the trend held true. Episodic poverty is much more common than chronic poverty.
United Way of the Midlands has a long history of caring for families who are experiencing fluctuating periods of financial stability.
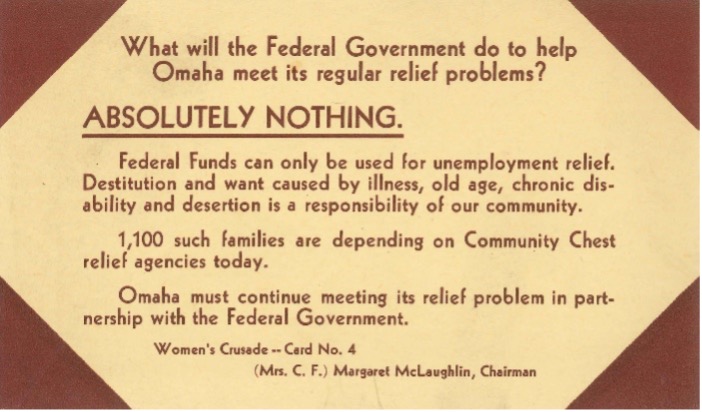
With the introduction of federal relief programs in 1933, the Community Chest (which is now UWM) changed its focus to serving individuals who were unable to receive government relief. This focus reflects the reality that programs often have narrow purposes, and eligibility requirements often miss populations who could benefit from federal and state programs. Today’s struggling households often make too much to qualify for benefit programs. For instance, nearly half of our community resource survey respondents were employed – but less than 25% were receiving benefits like SNAP, WIC or Disability.
As families seek to earn more to supply their basic needs, they begin to lose access to important benefits that are often needed along the way. The Cliff Effect occurs when wages from a new employment opportunity do not make up for a family’s loss of benefits, putting the family in a worse financial situation. It is a key contributor to financial instability and a systemic barrier that keeps hardworking families from gaining financial independence.
Last year, UWM investments and programs provided more than 2 million services to remove barriers and create opportunity.
Our Circle of Support means the community has a variety of resources available to help families in whatever need circumstance they may experience. Investments in financial stability programs specifically work to create economic mobility for youth, adults and families across the metro area. We invest in job readiness and placement programs to help families access living wage careers, and our Jobs for America’s Graduates (JAG) Nebraska program helps students across the state graduate and pursue educational or career pathways. UWM also invests in financial literacy and asset development programs to help families accumulate savings and stability for years to come. Together with the support of donors and partners across the region, we are working collaboratively to create pathways for economic mobility and reduce the number of families caught in this gap.
Sources
UWM Analysis using American Community Survey, 5-Year Data 2018-2022. Table B17016: Poverty status in the past 12 months of families by family type by work experience of householder and spouse.
Living Wage Calculator, Massachusetts Institute of Technology
Family Bottom Line, Voices for Children. Examined for Douglas, Sarpy and Pottawattamie counties. 2010 dollars adjusted for inflation.
Family Budget Calculator, Economic Policy Institute, 2022. Examined for Douglas, Sarpy and Pottawattamie counties. 2020 dollars adjusted for inflation.
Report on the Economic Well-Being of U.S. Households in 2022 – May 2023.
Community Resource Survey conducted August 2023 among 211 callers. Sample size of 762 is sufficient at 95% confidence and 5% MOE
American Community Survey, 2022. Table S1701: Poverty Status in the Past 12 Months and Table B17002: Ratio of Income to Poverty Level in the Past 12 Months.
Dynamics of Poverty Report, U.S. Census, 2017-2019 published December 2022.